| |||||||||
| Market-Based Odds | |||||
|
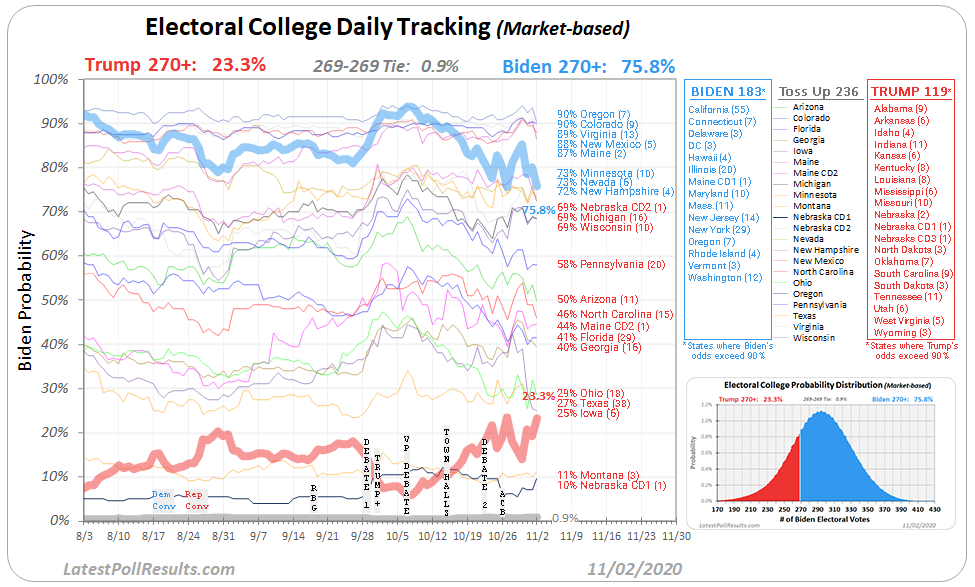
Method Real-money market-based pricing offers a new, exciting, alternative set of state-level odds to analyze. In 2016, with the success of the PredictIt.org marketplace, we began our market-based analysis of the Electoral College and the Senate. From individual contract pricing, we calculate each candidate's implied probability of winning, after adjusting for the 10% commission on winning trades. We determine the probability for the Democratic candidate and the Republican candidate and use these individual race probabilities to calculate the odds for every possible combination of outcomes and calculate each party's odds of winning.
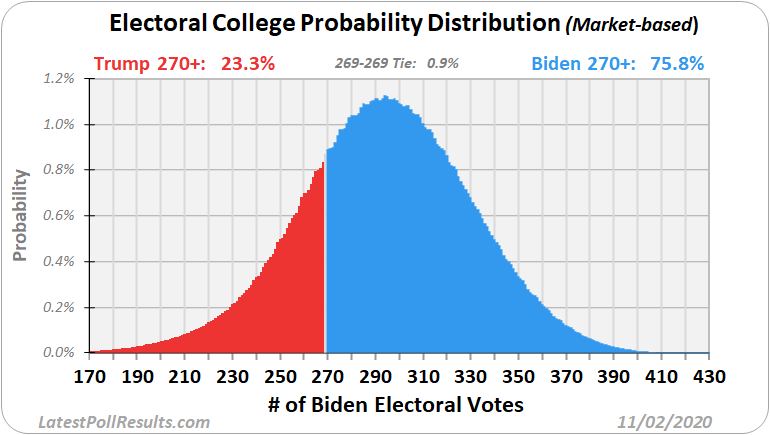
 Electoral College Probability Distribution (Market-based): 
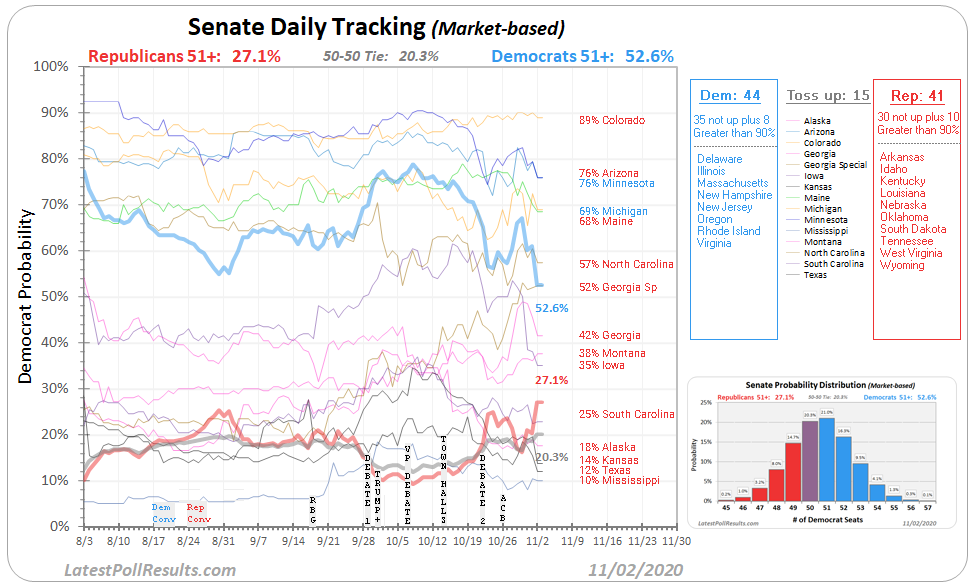
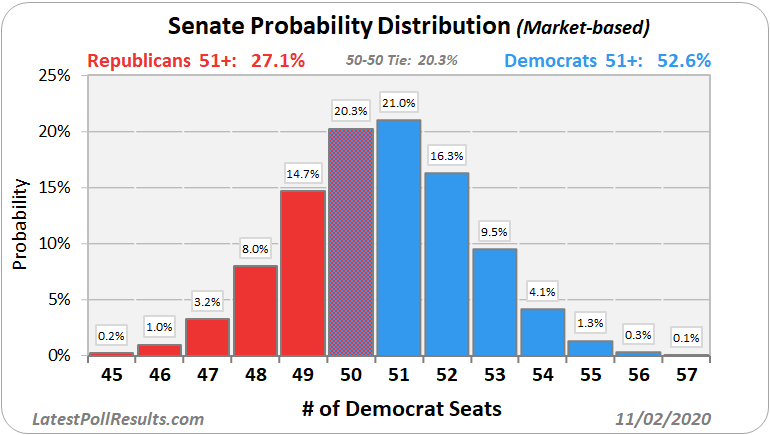
Senate Currently, Republicans hold a 53-47 edge in the Senate. This year there are 35 Senate seats which are up for election, 12 will be defended by Democrats and 23 by Republicans; 30 Republicans and 35 Democrats are not up for re-election. With 35 seats, there are over 34 billion, possible combinations of outcomes. From the individual race probabilities, we calculate the odds for every possible combination of outcomes and calculate each party's odds of winning.
The Senate Daily Tracker (Market-based):
| |||||


