| Home About Us Contact Us
|
|
| LatestPollResults.com projects: Republicans to Control the Senate Probability: 85.7% 
|
|
|
What is the significance of an 85.7% probability? It's analogous to an NFL football team being a 13.5 point favorite. They will probably win but sometimes the underdog will score a surprise upset. Today, Republicans are 13.5 point favorites!
LatestPollResults.com offers an unbiased, statistically-based probability analysis of the latest poll in each state to project the winner of the Electoral College for the Presidential election. Since 2010, we've applied the same analysis to project which party will control the Senate.
|
|
 | 
|
|
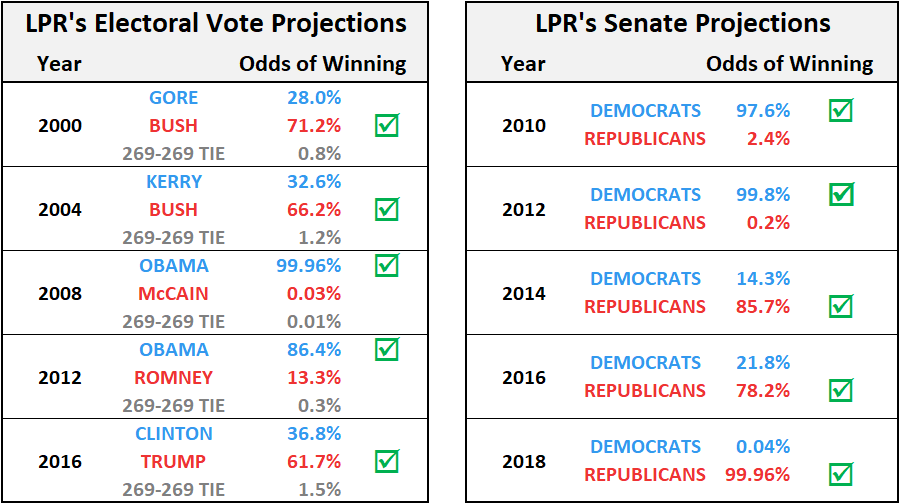
Each projection accurately predicted the election outcome. With each new state poll reported by my either RealClearPolitics or Electoral-Vote.com, LPR updates each candidate's probability of victory and the overall probability for the Democrats and Republicans to control the Senate.
LPR is tracking the latest projections of well-known analysts who also utilize state-level probability modeling and update their projections daily: FiveThirtyEight's Nate Silver, Princeton Election Consortium's Sam Wang, HuffPost Pollster, DailyKos.com, The NY Times' TheUpshot, The Washington Post's Monkey Cage and PredictWise, which partially draws its probabilities from bettors on Betfair.
In determining state probabilities, each analyst uses a unique methodology in regard to poll selection, poll weighting, historical trends, etc. After state probabilities for each candidate are determined, control of the Senate is then approximated by either running thousands (or hundreds of thousands) of election "simulations" or by exactly calculating the overall probability of winning by looking at all possible outcomes. LPR's model is straightforward. First, we only look at the latest poll in each state. From the poll's sample size and percentages for each candidate, the probability for each candidate is calculated using unbiased statistically-based probability analysis. States are considered "safe" for a candidate if his/her probability exceeds 97.5%. If a state is not "safe" for either candidate, we consider it to be a "toss-up" state. The "toss-up" states are then evaluated for every possible outcome. For each of these outcomes, LPR calculates the number of seats captured by the Democrats and by the Republicans and the probability associated with each outcome. The sum of the probabilities for all outcomes where the Democrats capture at least 50 votes is the overall probability of the Democrats controlling the Senate. Similarly, the sum of the probabilities for all outcomes where the Republicans capture more than 50 seats is the overall probability of the Republicans controlling the Senate. We calculate all possibilities, thereby eliminating the need for election "simulations." Here are LPR's current "safe" states and "toss-up" states. 

| |
|
|
